
And they lived happily ever after
How to tell the story of data
Published by Donata Petrelli on 01/07/2021
Image credits by Rain Bennett on Unsplash
Reading Time: 3 minutes
You don’t usually start a story with the ending. To say that “The prince finds Cinderella and they lived happily ever after” is much less effective than “Cinderella was forced to do menial jobs all day but … thanks to a slipper she is found by a prince and her fate changed” … surely that’s a different story!
This is what happens to data. Communicating to an interlocutor a crude data such as 3% or 1,352,000.00 will not capture his attention. Even if it is a number that is the result of great analysis, we must provide its history, such as its origin, context and evolution. In this way, we give value to data and thus we have succeeded in conveying information.
In practice
Let’s put that into practice and tell the “story of the revenue”.
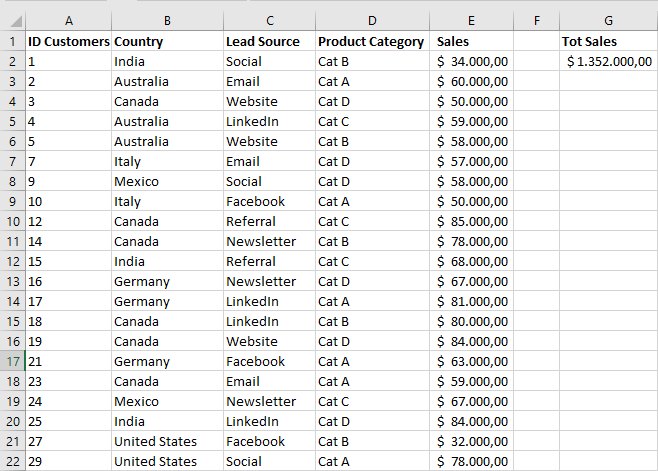
Knowing that the company’s latest revenue is $1,352,000.00 may not be very effective. Is this an average price by the company’s standards? Where did it come from? What costs did the company have to incur to support it? Answering these questions means getting to understand the meaning of the raw number and getting even more useful information for our business such as profits, cost and investment analysis, estimating upcoming sales and forecasting.
So what we need to do is to structure raw data within a story and tell it through illustrations. Its story is a structured table describing its origin and the illustration is its chart.
In our case we need to analyze the context of total revenue. So, let’s start from the simple analysis of the data by going to record the individual sales that make it up as in Figure 1
To deepen the story and make it more explanatory, we want to understand the logic that led to the end result. For example, surveying the sales brought in by the various marketing campaigns, divided by product category, will be very effective in understanding which means are most effective in selling our products.
Pivot Table
To do this we can use a Pivot Table from the previous table as shown in Figure 2.
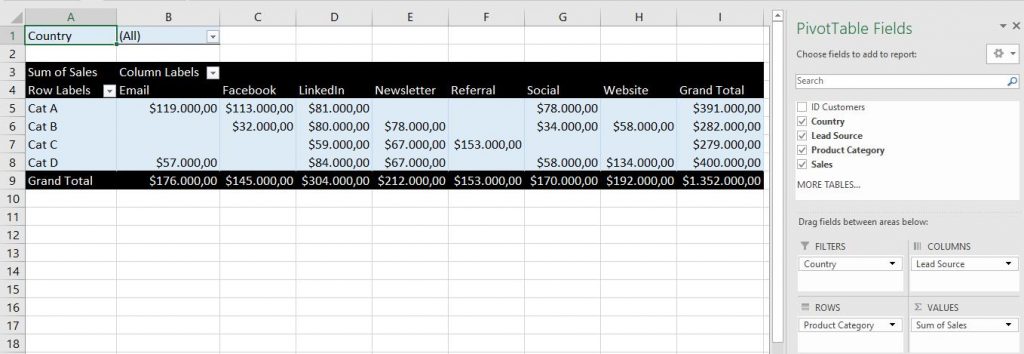
This is not intended to be a technical article, so I will not go into the technicalities of building a pivot table. What is instead important to know is that it is an excellent tool for organizing and displaying in different views data that is otherwise enclosed in a single table.
Reading the same final data 1.352.000,00 but decomposed according to leads and categories and filtered by country makes the story certainly more dynamic and clear!
Pivot Chart
We can still improve. Bearing in mind that our analysis often needs to be communicated to other people, who may have roles other than technical but strategic to the company, it is much more effective to illustrate it.
In this specific case, we use the Pivot Chart, as shown in Figure 3, to make the chart dynamic and flexible to our analysis needs.
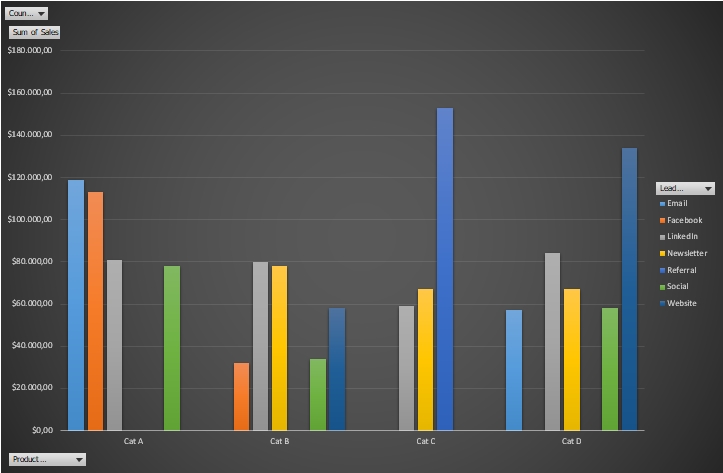
The choice of chart is critical. Knowing how to visually communicate a piece of data means finding the optimal graphic representation. Getting the style wrong can also decree the failure of the communication despite the analysis being correct.
The chart chosen in our example is one of the most appropriate to verify the most effective sales channel associated with each category.
Conclusion
All stories can be told in different ways. Our skill lies in conducting the analysis and proposing the most effective visual representation in terms of the objectives of the analysis and always taking into account the “communication” factor.
Choosing the right chart means analyzing what our audience needs in order to fully understand the information behind the data and communicate it in the simplest and clearest way.
A little tip if you are in doubt about which chart to use for your analysis. Try this tool of mine:
Published with licenza CC BY-NC-ND 3.0 IT (Creative Common – Attribuzione – Non commerciale – Non opere derivate 3.0 Italia)