Correlation with Bayes
A little bit of AI: Bayes, to infer from experience
Reading Time: 4 minutes
Post published on 27/03/2020 by Donata Petrelli and released with licenza CC BY-NC-ND 3.0 IT (Creative Common – Attribuzione – Non commerciale – Non opere derivate 3.0 Italia)
Never before must we be able to read and interpret data for our own good. From the biological sector to the medical sector, from the political sector to the financial sector, the current crisis shows that interpreting data quickly and correctly is fundamental for our very survival. Starting from data, our approach can be basically of two types: we can consider data as the effect produced by a given cause (deductive approach) or we can find the most likely causes from it (inductive approach).
In reality the phenomena are complex and the “cause-effect” relationship is often not so evident or there are many (too many) causes at the origin. Therefore, in order to find the most likely solution, the classic “cause-effect” approach is not satisfactory. Let’s try to change paradigm and take the challenge of knowledge through an inductive approach.
In this article we talk about one of the methods, taken from Artificial Intelligence, suitable for doing this: Bayesian Inference. Starting from the data, the Bayes theorem allows to calculate the likelihood of the causes, in terms of probability and thus allows to set the basis of any scientific research.
Let’s start!
Conditional probability
The process of knowledge starts with the observation of data. Following the inferential inductive reasoning, we can estimate what is the probability that they are the effect obtained at a certain cause. That is, we assume that our observed data is an event (E2) that occurs with the highest probability after the occurrence of a cause event (E1).
That’s “the conditional probability of E2 given E1” or “the probability of E2 under the condition E1” and is usually written as P(E2|E1).
The conditional probability formula is:
P(E2|E1) = P(E1∩E2)/P(E1)
For the compound probability the denominator becomes:
P(E1∩E2) = P(E2) * P(E1|E2)
Bayes’ Theorem
The classical approach, by which an observed event is the result of a given cause, defines the observed phenomenon as: P(Effect|Cause)
We change our perspective and we deduce the probability that observed data is the result of one physical phenomenon rather than another.
It is Bayes’ theorem that allows us to reverse the expression and deduce the probability of a certain cause as the origin of the observations: P(Cause|Effect).
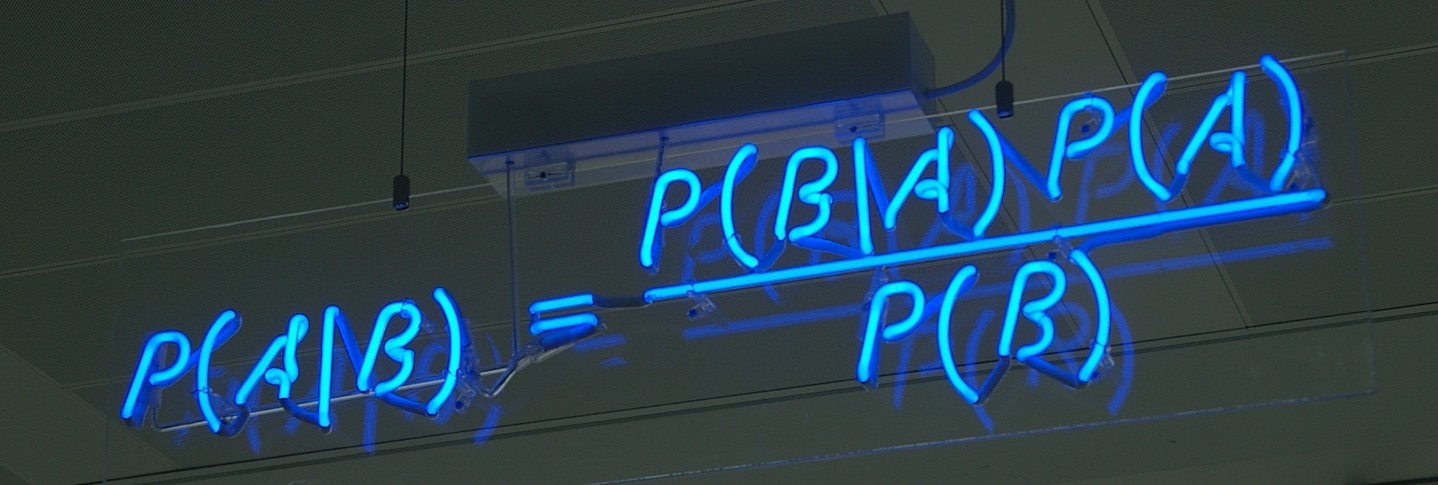
Date P(A) the probability of event A based on the initial information, i.e. the a priori probability, Bayes’ theorem tells us that the a posteriori probability P(A|B) is given by the formula:
P(A|B) = P(A) * P(B|A)/P(B)
Correlation indicator
This relationship can be read in several ways. First, it directly correlates the initial probability P(A) to the final probability P(A|B) by the factor
k = P(B|A)/P(B).
So Bayes’ formula becomes:
P(A|B) = k⋅P(A)
end it allows us to easily identify the relationship between events A and B in this way:
- If k > 1 then A and B are positively correlated
- If k = 1 then A and B are independent
- If 0 < k < 1 then A and B are negatively correlated
A Bayes application
In the medical field we can identify two approaches, deductive and inductive, in what are called medical pathology and medical diagnosis respectively. Medical pathology teaches how the signs given the disease behave, i.e. the effect given the cause. Medical diagnosis determins which disease explains signs, i.e. the cause given the effect.
Bayes’ theorem helps to know the probability of a disease if a person has a certain sign.
In scientific terms, it allows the transition from pathology to medical diagnosis and provides the basis for the subsequent process of decision making.
An example with Microsoft Excel
Let’s consider a test designed to detect the presence of a virus. To do this we make the following hypotheses:
- Sensitivity = 99.8%
- Specificity = 89.7%
We assume that the prevalence is 0.007% (7 out of 1000 are infected with viruses).
We calculate the predictive value of the positive test, i.e. the probability of being infected for a patient with a positive test. The same for negative test.
Using an Excel and Bayes’ formula
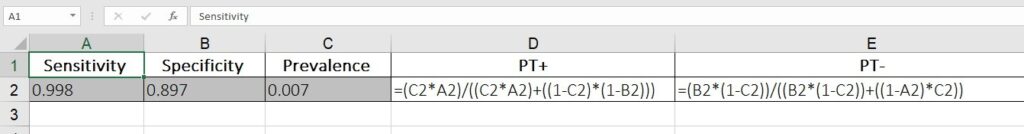
we get
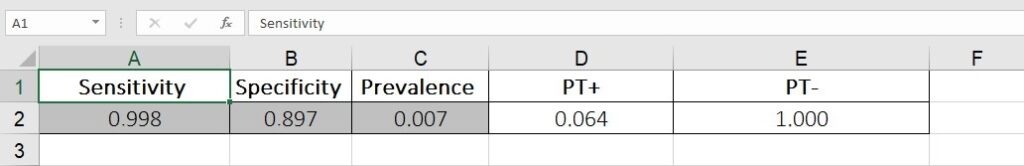
where PT+ is prediction of a positive test and PT- is prediction of a negative test.
From the different value of the results follow the correct decisions for diagnostic research.
Conclusion
Today more than ever, we can see that diagnostics and medical reasoning will be the challenge for the near future. But there are many fields that can benefit from medical diagnostics, such as finance, marketing, management.
The goal of this short article is to present a different method of doing research applied to the study of the correlation of variables and which is part of the collection of AI methods. The Bayesian model is however a very wide argument and it is not possible to talk about it in a single article… if you are interested I will be happy to discuss it in new articles.
What we’ve seen
- Deductive approach
- Inductiveapproach
- Bayesian Inference
- Conditional probability
- Bayes’ formula
- Microsoft Excel
Any comment you make on the article will be welcome, even more your like or reshare ?
You can also read this article on Linkedin at this address:
https://www.linkedin.com/pulse/correlation-bayes-donata-petrelli/