
Bayes with Excel
A little bit of AI: Bayes’ theorem easily with Excel
Reading Time: 5 minutes
Post published on 01/04/2020 by Donata Petrelli and released with licenza CC BY-NC-ND 3.0 IT (Creative Common – Attribuzione – Non commerciale – Non opere derivate 3.0 Italia)
Title Image credits by Sebastiaan Stam on Unsplash
From company manager to family man, from politician to school director, in critical situations we all have to make decisions. This regardless of our profession, education or qualification. In real life, there are no right or wrong choices in an absolute sense, but there are optimal choices – those that lead to maximum return or minimum loss. The ability to make the optimal choice is today more than ever a necessity!
In the scientific field, there is a discipline that deals with this, called Operations Research. Its purpose is in fact to help make the best decisions in complex situations. Through mathematical techniques, it allows to reach a certain objective respecting constraints imposed from the outside and independent from who has to make the decisions.
The goal of this article is to show a technique, from the class of Machine Learning, which allows us to learn how to make the best choices each time, just as the method of Operations Research teaches. That’s the Bayes model that starting from experience solves complex problems through inductive logic.
For a practical application we will use Microsoft Excel, a powerful, flexible and user-friendly tool.
Bayes’ Theorem
In inductive analysis, the Bayes’ theorem is considered as the probability theorem of the causes of a certain event.
We assume that an observed data A occurs with the highest probability after the occurrence of the cause B event. Bayes’ theorem calculates this probability through the formula:
P(A|B) = P(A) * P(B|A)/P(B)
In other words, it is able to assign to each hypothesis, which can “explain” a certain event, the corresponding probability.
Bayesian network
A scientific approach to solving complex problems formalizes the problem into a mathematical model from which we can calculate an optimal or approximate solution.
In general for the construction of a model we have to identify:
- independent variables
- dependent variables
- parameters or constants
The final model is the visual representation of the resolving function.
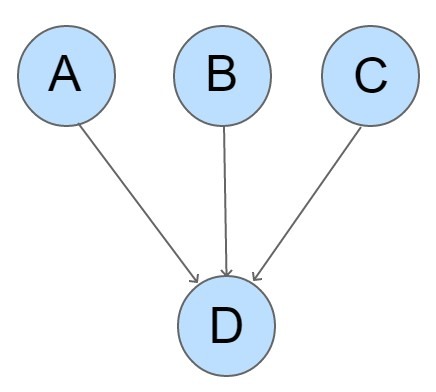
From Bayes’ formula we move on to the construction of his model. The Bayesian network is a model of inductive knowledge starting from Bayes’ formula and is represented by a probabilistic graph in which:
- independent variables are the “causes” of a problem and are represented by parent nodes
- dependent variables are the “effects” and are represented by the following parent nodes
- statistical dependency relationships between variables are the links between nodes represented by arrows
Conditional probabilities are associated with each node in the network. A basic example is the following:
The final result is a network with high computational efficiency.
Solve a problem by using Solver
Solver is a Microsoft Excel add-in program you can use for what-if analysis.
Solver command is on the Data tab, in the Analysis group

For Excel 2010 and later, after click Solver we get the following window:
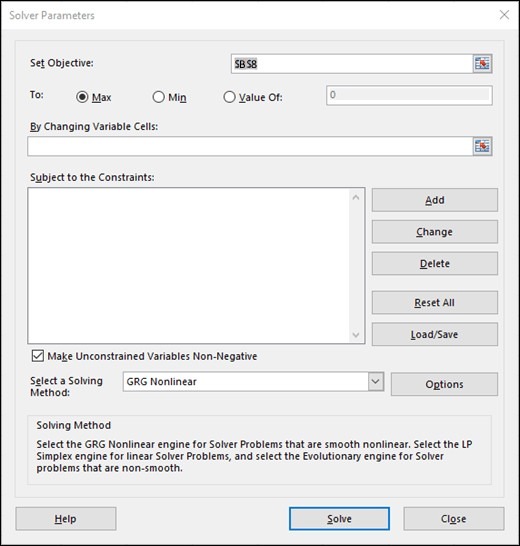
where to set:
- Variable cells, whose value is determined by Solver
- Constrained cell
- Objective cell
The method of resolution requires a separate examination. It concerns the algorithms with which the Solver will have to find the optimal solution to the model… if you want, I can talk about it in a new article 🙂
Example
Let’s take a practical example at this point. Let’s consider one of the problems that arise when we have to start an online marketing campaign: applying the best marketing strategy in terms of impressions and visits to the site, respecting the budget constraint.
The possible options are:
- keywords
- newsletter
- blog articles
For each of the possibilities are associated: the target acquisition cost, marketing operating expense and number of targets.
We write the general formula of the budget calculation:
MARKETING BUDGET = (ACQUISITION COST * NUMBER TARGETS) + OPERATING EXPENCE
in cell B1 and the values of the variables in cells D4:F6 of the model. You get:
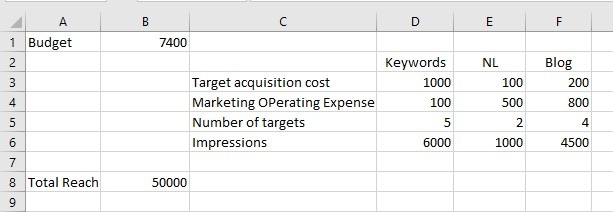
which evidently does not solve the problem because the budget is over 50%!
To find the optimal solution, we use Solver in this way:
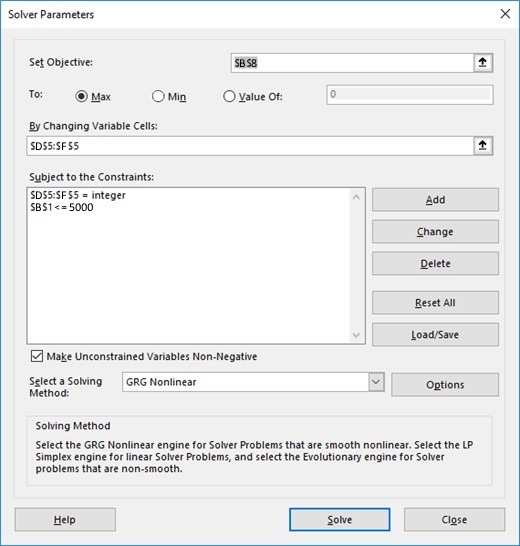
Click Solve. You’ll see the optimal number of target for each marketing action.
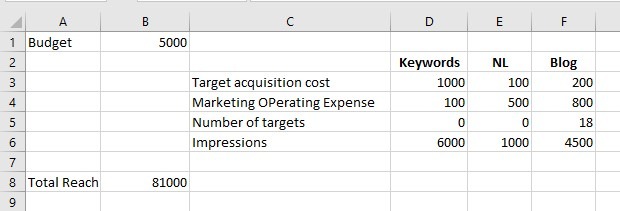
Thanks to the Bayesian model put into practice through Solver, we obtain the best solution to the problem (81000 visits compared to the previous 50000) respecting the budget constraints.
Conclusion
The example seen in this article uses Bayes’ theorem as a logical support in the area of corporate marketing. In reality, its use can be extended to the whole business management, from the economic one to the logistic one, as it is a problem solving technique.
Its fields of application are many and varied, from engineering to military, from political and social to medical. Even if these AI techniques indicate the best solutions, the final decision must still be taken by human discernment!
This short article aims to suggest a very powerful and little known tool like the Excel Solver. Then everyone will adapt the concepts for their own needs and work cases
What we’ve seen
- Operations Research
- Bayes’ theorem
- Machine Learning
- Bayesian networks
- Graphs
- Microsoft Excel
Any comment you make on the article will be welcome… even more your like or reshare ?
Good Bayes, everybody!
You can also read this article on Linkedin at this address:
https://www.linkedin.com/pulse/bayes-excel-donata-petrelli/