
Who moved my shoes?
The importance of Cluster Analysis!
Published by Donata Petrelli on 26/08/2021
Image credits by Jakob Owens on Unsplash
Reading Time: 3 minutes
Have you ever had to move? In these cases one of the biggest challenges is to figure out how to organize the objects in the spaces that are still empty… In my case it was figuring out how to arrange my shoes! In fact, the initial “organization” phase will determine the ease and speed with which we will later dispose of all the objects and therefore the quality of life in the house itself.
The same happens with data. When we are dealing with a large initial amount of raw data, the first goal is to understand how it is distributed. Only then can we move on to processing it with the various algorithms.
Cluster Analysis does this!
There are several clustering techniques that differ in terms of input variables, speed, required computational resources and the type of partition produced (hierarchical or partitional). What they have in common is the objective of the analysis: to group objects into groups with a certain degree of homogeneity.
What does this mean?
Starting with the definition of a cluster, as a collection of objects/data, the resulting groupings must meet these requirements:
- Similar with respect to each object in the same cluster
- Dissimilar with respect to objects in other clusters
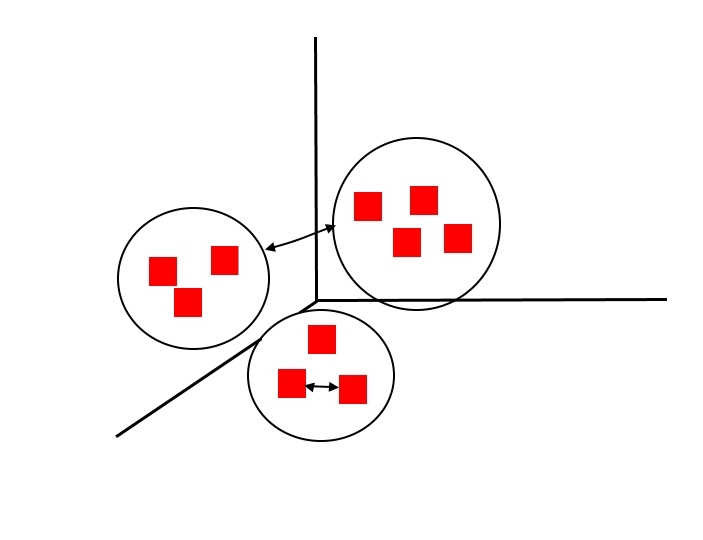
When choosing the method, therefore, we must keep in mind the ultimate goal, which is to obtain high quality clusters with:
- High intra-cluster similarity
- Low inter-cluster similarity
To help us in the final evaluation of the choice there are then of the specific mathematical indicators for the measure of the goodness of the model.
In the case we consider good clustering if:
- the variance in clusters is small
- the variance between clusters is large
where the variance within a cluster is the sum of squares of the distances of the points from the center of the cluster and the variance between clusters is the variance of the centers of the clusters with respect to the center of the centers, we can use the mathematical indicator SSE (Sum of the Squared Error). This is the sum of the squares of the various errors, where the error is defined as the distance from the center of the cluster.
Its formula is:

where
- p is a cluster point
- Ci the point cluster
- m is the center (centroid) of the cluster
Using this indicator, given two clusters from two different run trials we can choose the one for which the SSE value is minimum.
Clastering analysis is applied in a wide variety of areas, such as:
- in Marketing for targeted marketing
- in Economics for market research
- in the Insurance sector to identify groups of insured with common characteristics
- in Trading and Finance for Pattern Recognition
- Analysis of spatial data to create thematic maps in GIS
- Clustering of Weblogs to discover groups of similar access patterns to a Web site
Whatever the field of application, it’s a good idea to pre-process data through clustering methods for optimal results that support operations and decision making.
That’s why I no longer waste time looking for my shoes 🙂
Published with licenza CC BY-NC-ND 3.0 IT (Creative Common – Attribuzione – Non commerciale – Non opere derivate 3.0 Italia)