
Forecasting Models with Excel
A brief overview
Reading Time: 6 minutes
Post published on 08/10/2020 by Donata Petrelli and released with licenza CC BY-NC-ND 3.0 IT (Creative Common – Attribuzione – Non commerciale – Non opere derivate 3.0 Italia)
Title Image credits by Kelvin Yup on Unsplash
Knowing the future has always been the worry of man. Both in the case of simple events and more complex ones, understanding how they will evolve will allow us to plan many activities, from daily to long-term ones.
Aware of the fact we cannot predict the future and omitting esoteric methods, like card reading and coffee grounds, what we can do is to adopt scientific methods that can aid us in finding the value that is near the highest probability to the future one assumed by a certain real phenomenon.
In this brief article we can see some powerful tools made accessible by Microsoft Excel to carry out this task.
Mathematical Models
In mathematics and statistics there exist various techniques in order to make predictions. They start from the analysis of chronological data originating from the environment of departure. Therefore, each allows for a peculiar function which describes in the most realistic terms possible, their behavior over a period of time. In more technical terms we are talking of mathematical models, the scope of which being to explain the environment, which data are images find the trend and it’s future trend.
The majority of traditional mathematical models use regression models to evaluate the trend of a trend of values. The underlying logic is to find that function which renders the smallest error possible between the estimated values of the model and those of the phenomenon arrived at over the whole temporal time frame of observation. On the other hand, others start from statistical logics and are based on adaptive models or equalization. In this case the logic underlying the modal is that which thinks that the present value is in a certain sense the expression of its evolution, given its history. So that to attribute a value, it is enough to find that number which expresses the temporal significance, for example, the average value. The use of one method rather than another merits a separate discussion. The level of knowledge of the data and of the environment from which is originates, the research objective, the available resources and the actual experience of the analyst often intervene in a significant way in the choice.
Data
Mathematical models describe the phenomena of the real world using their processes beginning with the data. The methods which we see are tools which we universally valid for the forecasting of future values which transcend from the context, and therefore, from the type of data used. For the purposes of this article I will use financial data as the financial markets are one of the major environment in which the use of data is requested and applied. Within the examples and images that i will use, the represented data indicate the closing price of a share. This is an “editorial” personal choice. However, in reality all the following methods and functions attached are also adaptable with all actions, such as the opening price, minimum and maximum, and the volumes.
Know the trusted sources where you can find the data, know how to extract and import them to Excel, as well as knowing how to apply pre-processing techniques to raw data obtained, These are all key aspects to take into account in order to make a correct and how much more reliable forward-looking analysis. Not being able to cover with a single article all these topics, i invite you to follow the next where will be treated in details.
Graphical Forecast Methods
When we are presented with what to do when faced with values in a temporal order, the first and simplest thing to do is to represent them graphically. In this way, that is, as points placed within a Cartesian plan in which the horizontal axis is the temporal one, it is easier to see their behaviour through time and therefore hypotheses on their future.
Using Excel is simple, either to construct a chart of the points and to find the equation that represents the trend as suggested by the regression model. It consists of the straight-line equation which represents the trend-line within the points chart.
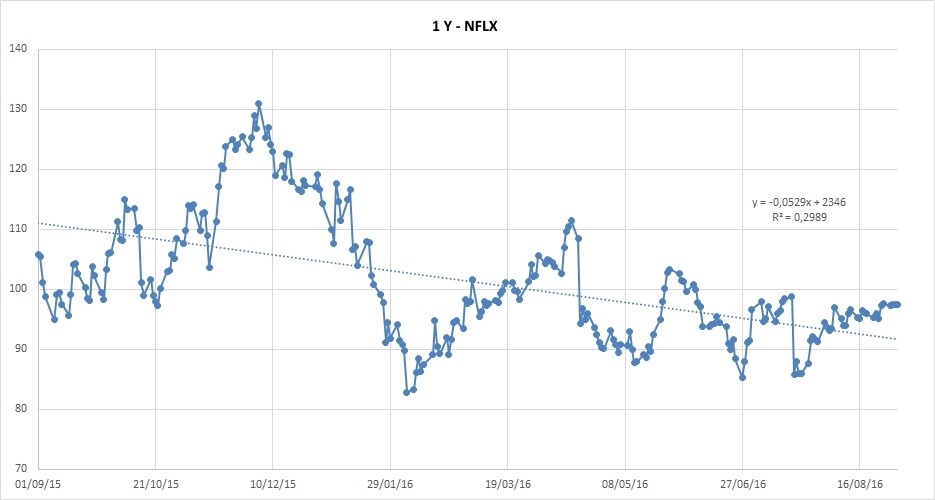
In order to visualize the line within the points graph as shown in Figure 1, the procedure is quite simple. All that is needed is to position the mouse above the series of data then press the right click button. Within the scroll down menu which appears it is just a matter of selecting the option “add line of trend” and you have the end result.
If you wish to increase the accuracy level of the model, you may utilize more elaborate functions of the line, such as polynomials of higher grade than the first.
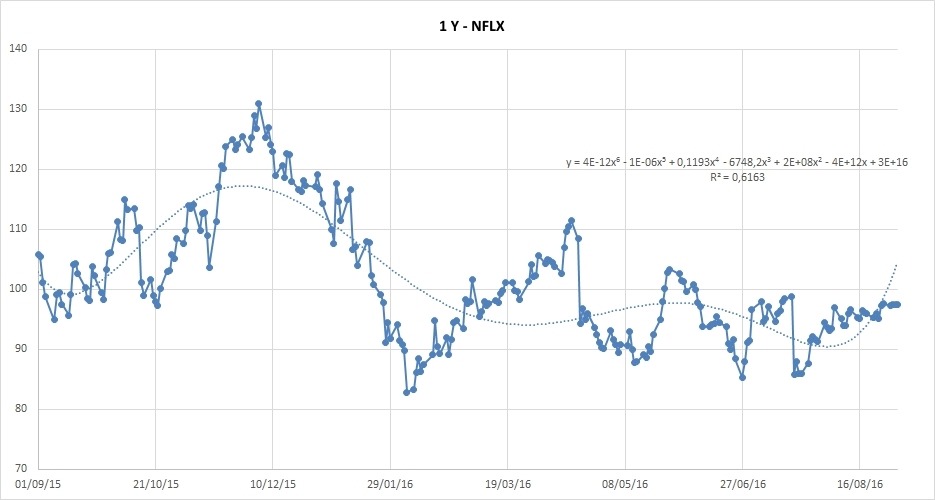
Within the same window obtained from the previous operation of inserting the trend line within the graph, you have the possibility to change the type of line. From here it is possible to choose from different options: polynomial, as shown in Figure 2, exponential, logarithmic, power and moving average.
The model which is more adaptable is dependant upon the context in which we find ourselves and naturally, of the disposition of those same points. Which surprises across the use of Excel is how it is possible to apply various models, even those more sophisticated, with unparalleled practicality and speed.
Model Valuation
Therefore, what infinitely interests us is understanding the level of reliability of one model as opposed to another. In understanding how close to reality the model is, makes it truly a useful tool in the understanding of future value data. In this perspective, each model which is trusted should predict an index which measures its goodness, in order to render the user capable of knowing with how much faith to take into consideration with regard to the furnished results. In the other cases we have used and shown in the chart the indicator which is called R^2.
Excel gives the possibility to visualize straight in the chart once choose the trend line equation. This is an indicator of the reliability of the regression model and assumes values between zero and one.
A value of R^2 null or next a 0 indicates poor reliability, conversely, the unit value or next to 1 reveals that the model explains the data correctly. Also the models of exponential equalization patterns reported by Excel have their own unique indicator for the measurement of reliability.
Forecast Functions
If chart help us to understand visually and, therefore, quickly the trend of a numerical series, at the end it is still necessary to calculate the numerical value of the future data. For this purpose there are the statistical functions of Excel that are called forecast functions.
Whether we have to work with regression models rather than equalization, Excel satisfies both needs through the linear forecast functions for the first case and forecast ETS for the second. Once you have obtained the values table, in the specific case the column of price closures, in correspondence with the corresponding dates, just position on a cell in which to show the final result and launch the preview function from the menu ”formulas/other statistical functions”. Their use is therefore immediately and easy, thanks to the wizard that will be presented for their correct composition.
Forecast Worksheet
If things so far seemed more complicated to us than what the writer wants to communicate or, even, it is not our job or our priority to choose the technique to use but what interests us now is only to forecast Excel makes available a fantastic tool which autonomously allows to carry out forecast analyses: The forecasting worksheet.
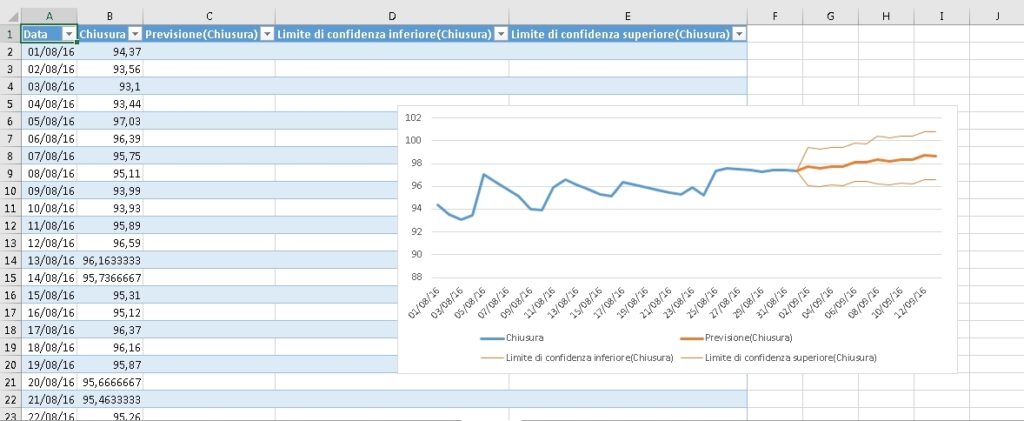
Thanks to the forecasting worksheet, on the basis of chronological data, we can create a forecast in a simple way. In fact Excel creates a worksheet in which coexist both chronological data and those included. In addition, and without any effort on our part, it will be reported the chart obtaining a final exhaustive sheet as shown in Figure 3.
The procedure requires the presence of a range containing the timeline and the interval sequence of the corresponding values. Then you select and proceed by inserting the baseline worksheet from the forecast sheet data menu item. The final result will be shown in a new Excel spreadsheet and represents the analysis made directly by Excel, through the use of standard forecast formulas.
The final observations that follow and the decisions that arise from it are and will always remain the tasks of the user and their common sense.
What we have seen
In this article we talked about:
- Excel
- Forecasting models
- Graphic analysis of trends
- Forecasting Functions
- Models Reliability indices
- Forecast sheet
More Information
This article is only an introduction to a very vast and fascinating topic such as those of forecasting models and it can not answer the many questions that will arise in the minds of the most curious and interested. To all these, i would advise further research of articles and specific manuals on mathematics and statistics, which may be more transversal. Among these last books i would suggest Trading with Excel, not only because i am one of the authors, as you might rightly respond, but because it contains a entire chapter dedicated to methods of forecast.
Good Excel 🙂