
Kurtosis of data distribution
How statistical index helps you make better decisions
Reading Time: 4 minutes
Post published on 06/01/2021 by Donata Petrelli and released with licenza CC BY-NC-ND 3.0 IT (Creative Common – Attribuzione – Non commerciale – Non opere derivate 3.0 Italia)
Title Image credits by Adam Nowakowski on Unsplash
Every day we read prospectuses, tables and graphs relating to various aspects of our lives, from stock market values, weather conditions, demographic data, to supermarket loyalty card data or web service packages.
In a world dominated by data, statistical analysis becomes one of the basic and indispensable tools for interpreting data. This is true not only for scientists, managers, entrepreneurs, sociologists, politicians but for all of us.
In a previous article we analyzed how statistical analysis allows to evaluate a data distribution through the use of the Gaussian model and how this technique can help us to find a solution to decision-making problems.
In this article we want to deepen this important methodology going to analyze the shape of the distribution, thanks to an index called kurtosis, and how from it we can draw important information for our operational decisions.
If you are curious to find out how it is possible to know data through its shape, you just have to continue reading!
Coefficient of Kurtosis
Statistics, like many other disciplines, uses indices to summarize the observed data. One of the categories of indices is that related to shape.
In this view, kurtosis is the maximum height reached in the frequency curve of a statistical distribution, and kurtosis is a measure of the sharpness of the data peak relative to the normal distribution.
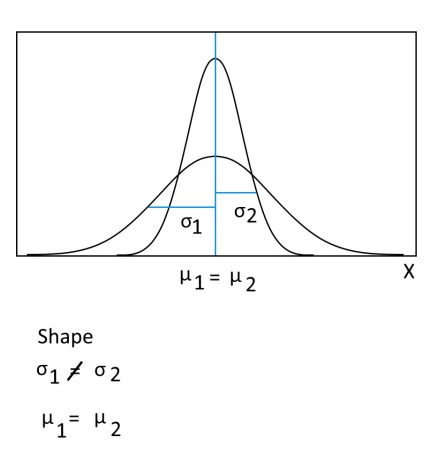
The graphical representation of kurtosis allows us to understand the nature and characteristics of the entire distribution and statistical phenomenon.
Its formula is:

where
m4 e m2 are respectively the central moment of order 4 and 2
or
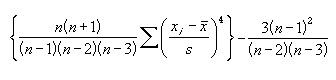
where s is the sample standard deviation.
Traditionally the value of this coefficient is compared to a value of 0.0, which is the coefficient of kurtosis for a normal distribution, i.e., the bell-shaped curve. A value greater than 0 indicates a peaked distribution and a value less than 0 indicates a flat distribution.
- if K >0 the curve is leptokurtic (peaked)
- if K =0 the curve is mesocurtic (normal)
- if K <0 the curve is platykurtic (flat)
Kurtosis with Excel
You may have noticed that the calculation of the index is not exactly simple. This is where Excel comes in and the KURT function, which returns the kurtosis of a set of data.
Its syntax is:
KURT(number1, [number2], …)
where:
number1, number2, … are arguments (from 1 to 255) for which you want to calculate kurtosis. (Number1 is required, subsequent numbers are optional).
Example
Let’s take an example to see how simple it is to calculate the kurtosis index with Excel.
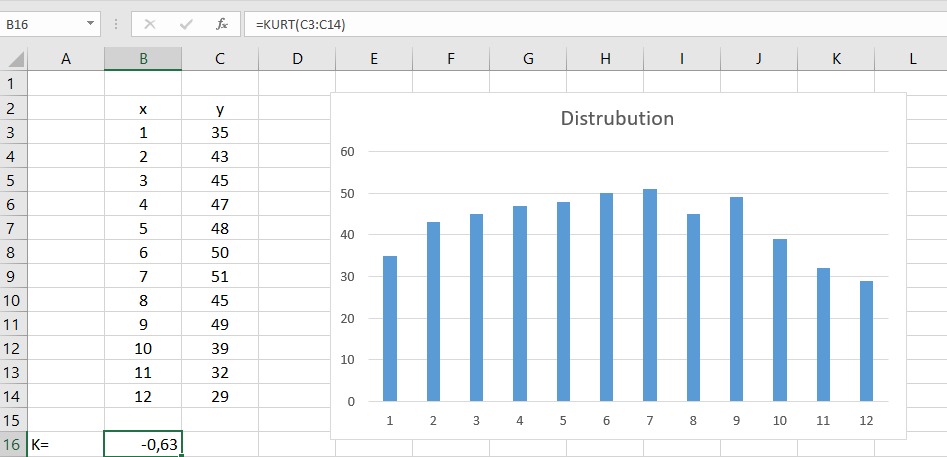
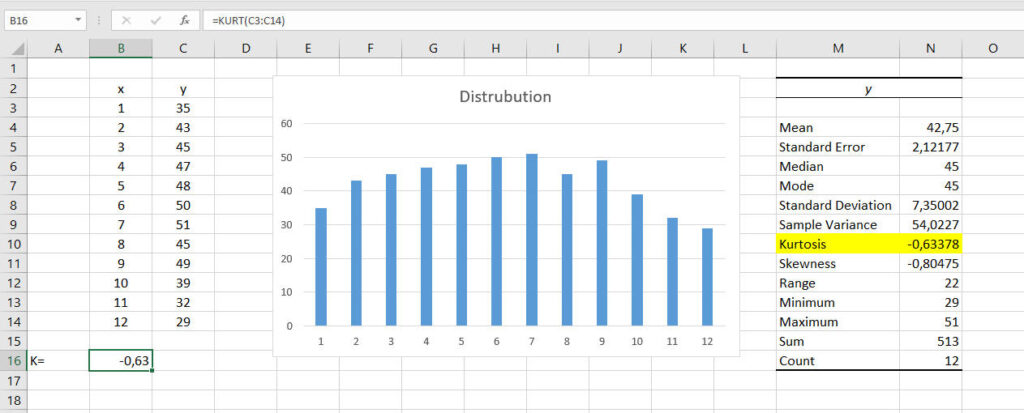
For this purpose we consider the following distribution of 12 values:
35; 43; 45; 47; 48; 50; 51; 45; 49; 39; 32; 29
and we put data in columns B and C of an Excel sheet. At this point just enter in an empty cell, B16, the function =KURT(C3:C14) and you get:
K = – 0.63
as shown in Figure 1:
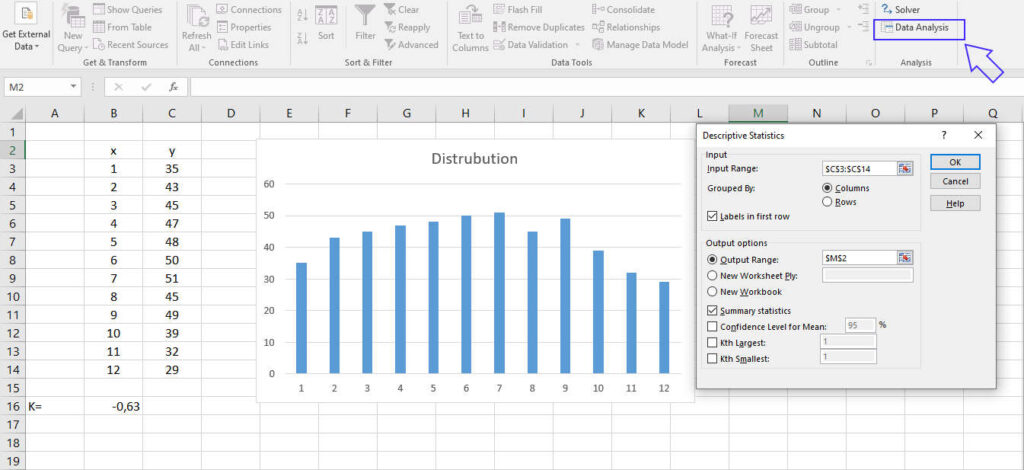
Alternative Calculation
The same index can be calculated in Excel using the Descriptive Statistics tool of the Data Analysis as shown in figures 2 and 3:
Kurtosis Meaning
In statistics and probability theory, the frequency curve is a measure of the probability distribution of a random variable with a true value.
Although the normal distribution is the distribution used most frequently, it is sometimes not appropriate to represent the randomness of phenomena, as it tends to underestimate the probability attributed to extreme events.
A higher frequency curve means that the increase in variance is due not to frequent moderate deviations but to extreme rare deviations. This mode of observing heavier tails than the normal distribution is termed leptokurtosis.
Leptokurtic distributions have the peculiarity of assigning a higher probability to events that are very far from the mean value of the distribution. For this reason we also speak of distribution with thick tails. The presence of leptokurtosis is also compatible with the hypothesis of time-dependent variance.
Conclusion
From the graphical analysis of a distribution it is already possible to understand the character of the data.
In general, the collected data can be summarized and described by means of indices. Depending on whether one wants to emphasize position, variability, or statistical relationships, one has the respective families of indices.
In this short article we have examined shape analysis, considering the kurtosis index.
Leptokurtic analysis is applied in many areas. For example, in the financial sector, it proves valuable for analyzing the returns of instruments in relation to extreme events.
What indices do you use in your work?