
Data Analysis with Excel
how to get important information from even a few data
Reading Time: 6 minutes
Post published on 14/01/2021 by Donata Petrelli and released with licenza CC BY-NC-ND 3.0 IT (Creative Common – Attribuzione – Non commerciale – Non opere derivate 3.0 Italia)
Title Image credits by John Schnobrich on Unsplash
Who says you can’t get valuable information with little data?
Whatever work or activity we do, data analysis allows us to gain essential information for decision making. Often we are led to think that we need to have large amounts of data in order to obtain useful information …. nothing could be more wrong!
Even from small, one-dimensional databases with few fields, we can get very valuable information for our business.
What is important is to know how to read them to get the answers in the direction of our goals.
In this short article, we want to demonstrate how from a single column of data it is possible to do this. If you are curious, I invite you to continue reading
Different Analyses for Different Purposes
A brief introduction before we begin.
We have already discussed what data is in a previous article and how it is organized into structures called databases in a second. Now we ask: what is data analysis?
It is the processing of a database by means of techniques originating in mathematics, statistics, AI, suitable for different purposes such as:
- study of characteristics
- search for significant values
- extraction of information
- creation of interpretative models
- creation of predictive models
In the statistical field, data analysis can be:
- Descriptive: it deals with the detection, classification, synthesis and representation of data obtained from the study of a whole population or a representative sample
- Exploratory: it deals with the detection of diversity, anomalies or abnormal characteristics present in the data.
- Confirmatory: deals specifically with the confirmation of existing hypotheses
- Predictive: focuses on the application of statistical models with the aim of making predictions.
Depending on the area of application, a type of data analysis is then used.
For example, in the business field of Business Intelligence analysis is based primarily on data aggregation, in the scientific and industrial field Data Mining aims instead to extract information from large amounts of data for descriptive and predictive purposes.
Case Study
After this brief introduction, let’s start with a case study so as to better clarify the power of statistical data analysis methods for finding specific solutions and let’s analyze a common case of business sales analysis, starting from a data base like the one in Figure 1.
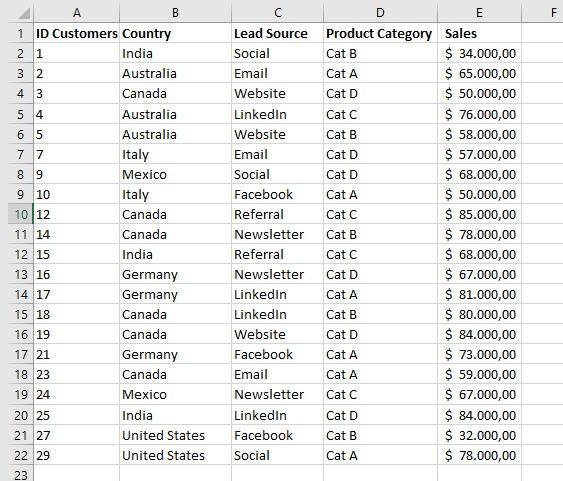
This is the situation that you can commonly find in many companies, after retrieving data from your ERP or CRM.
At first glance it may seem like an incomprehensible grid. In reality, it can tell us a lot.
Let’s proceed step by step.
Main Analysis
To simplify the demonstration and to support the thesis that it takes only a few data to get useful information, let’s consider only the sales field.
The first statistical analysis on the sales that we can make are those relative to:
- Sum, whit SUM function
SUM(number1,[number2],…)
where:
number1 Required. The first number you want to add.
number2-255 Optional. This is the second number you want to add. You can specify up to 255 numbers in this way.
- Mean, whit AVERAGE function
AVERAGE(number1, [number2], …)
where:
Number1 Required. The first number, cell reference, or range for which you want the average.
Number2, … Optional. Additional numbers, cell references or ranges for which you want the average, up to a maximum of 255.
- Standard Deviation, whit STDEV.S function
STDEV.S(number1,[number2],…)
where:
Number1 Required. The first number argument corresponding to a sample of a population. You can also use a single array or a reference to an array instead of arguments separated by commas.
Number2, … Optional. Number arguments 2 to 254 corresponding to a sample of a population. You can also use a single array or a reference to an array instead of arguments separated by commas.
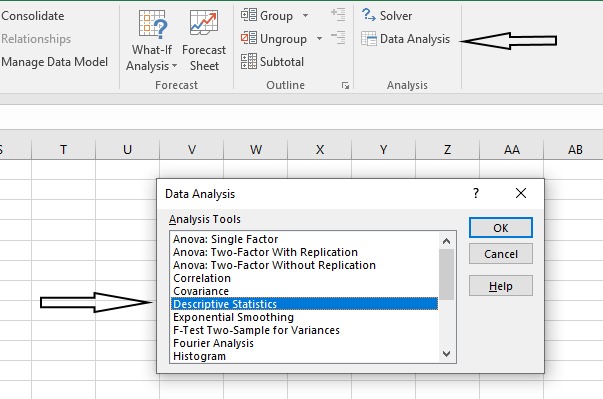
To get a comprehensive statistics report on the “sales” field, we can use Descriptive Statistics tool on Data Analysis in the Analysis group on the Data tab (Figure 2)
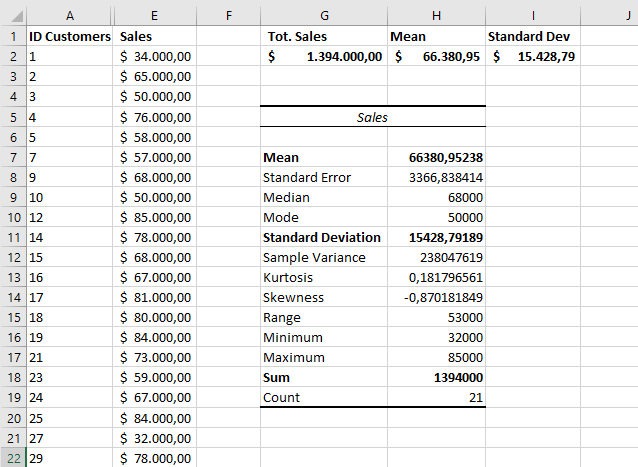
This tool generates a report of univariate statistics for data in the input range, providing information about the central tendency and variability of your data, as shown in Figure 3
Here is the list of functions:
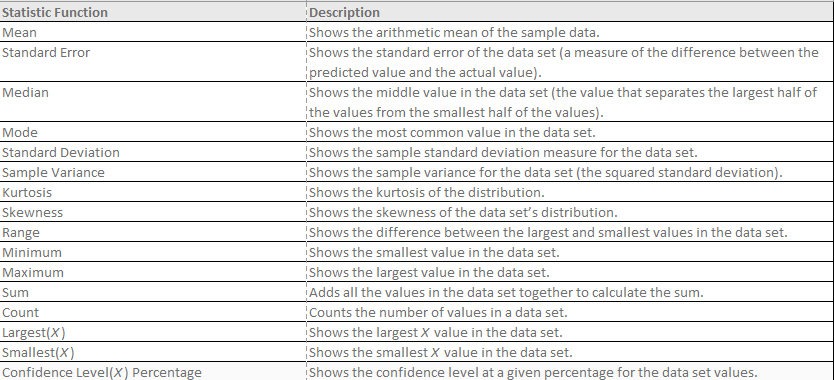
The functions listed above can be found in Excel’s statistical functions class. This tool allows their calculation more quickly. For those who want to learn more about the intrinsic meaning of these statistical functions I can recommend reading the articles on Kurtosis and Gaussian where I discuss them.
Thanks to the use of the descriptive analysis tool, we can quickly and easily obtain the first significant information regarding the benchmarking compared to the past and the analysis of the main Customers.
Let’s see how we can deepen this last aspect.
In-depth with Frequency Analysis
A further analysis is that of frequency, thanks to which it is possible to identify and classify clients and help us understand even better the quality of the information we can draw from the sales column alone.
Frequency distribution involves the following steps:
1. Counting the number of observations of the variable through the COUNT function:
COUNT(value1, [value2], …)
where
- Value1 The first item, cell reference, or range within which you want to count numbers.
- Value2, … Optional. Up to 255 additional items, cell references, or ranges within which you want to count numbers.
2. Determination of the Minimum and Maximum value of the observations through the MIN and MAX functions:
MIN(number1, [number2], …)
where:
- Number1, number2, … Number1 is optional, subsequent numbers are optional. 1 to 255 numbers for which you want to find the minimum value.
MAX(number1, [number2], …)
where:
- Number1, number2, … Number1 is required, subsequent numbers are optional. 1 to 255 numbers for which you want to find the maximum value.
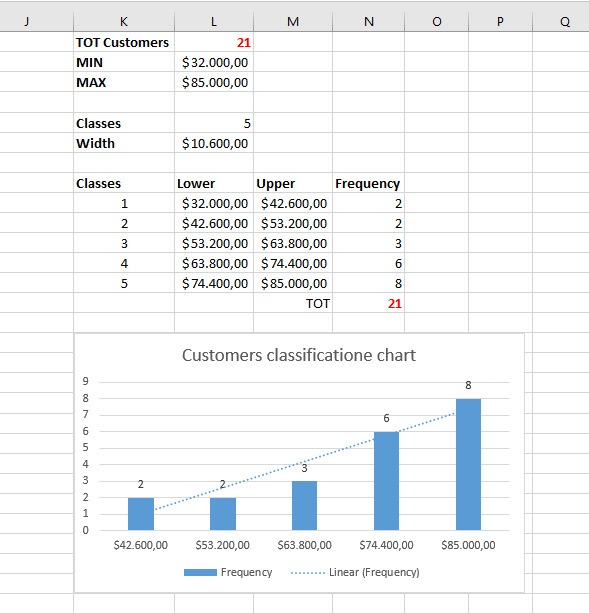
3. Definition of the CLASSES:
- N. of classes = Square Root of the number of observations
- Class size = ( VMax – VMin ) / N. classes
- Definition of the extremes (Lower and Upper) of each class
4. Count the absolute frequency of each class using the FREQUENCY function.
The FREQUENCY function calculates how often values occur within a range of values, and then returns a vertical array of numbers. Because FREQUENCY returns an array, it must be entered as an array formula. The FREQUENCY function syntax is
FREQUENCY(data_array, bins_array)
where:
- data_array (Required) is an array of or reference to a set of values for which you want to count frequencies.
- bins_array (Required) is an array of or reference to intervals into which you want to group the values in data_array.
If you have a previous version to Microsoft 365, the formula must be entered as a legacy array formula by first selecting the output range, entering the formula in the top-left-cell of the output range, and then pressing CTRL+SHIFT+ENTER to confirm it. Excel inserts curly brackets at the beginning and end of the formula for you.
The total of the absolute frequencies must coincide with the number of observations
Finally, inserting the histogram graph it will be even more evident how the acquired clients are classified according to their range of sales
Conclusion
From this simple example, we have seen how important it is to do data analysis, regardless of what data we have, to gain valuable insights into your business.
In this example we have used the power and flexibility of Excel, but it is possible to do the same analysis with any other spreadsheet.
The purpose of this article is not to focus on one tool rather than another, but to make us aware of how, even with little data and popular tools, we can make much more in-depth analyses than we might initially think.
The important thing is to have data … then you can have fun in many ways J
What kind of analysis do you do for your work?