
What happened to Access?
how Excel brought the typical tools of database into a spreadsheet
Reading Time: 5 minutes
Post published on 22/10/2020 by Donata Petrelli and released with licenza CC BY-NC-ND 3.0 IT (Creative Common – Attribuzione – Non commerciale – Non opere derivate 3.0 Italia)
Title Image credits by Joshua Sortino on Unsplash
Working with data is an activity that involves all of us, no one excluded. If it isn’t for business reasons it’s for personal reasons … even if it is only for the statistics of fantasy football or updating the shoes collection 🙂
Who, like me, started working with data many years ago will surely know Access, the Microsoft database designed for personal productivity and, as such, easy to use even by non-experts.
The first version was released in 1992. Almost 30 years later its use is no longer as widespread and popular as before, although the need to work immediately with data remains, indeed it is growing.
The question we ask ourselves is: what is the easiest and most immediate way to work with data today?
If you are curious or you need to update your database of shoes or fantasy football statics, I invite you to continue reading the article.
Once upon a time …
Since the 1990s, Access has been one of the tools that many of us have used to work with our data. Both professionals and less experienced users had the possibility to handle their data quickly thanks to this powerful tool.
In fact Access is usable by everyone because it allows the creation of a database in a very simple way. You just have to insert the data, related to our list of names or products or costs, in tables. These tables can be single or related to each other. Just as easily the tables can be subsequently processed to quickly extract analyses in the form of queries and reports as required.
That’s why it is ideal for all non-professional users but also for the most experienced ones who can check their data at prototype level before switching to more sophisticated software and specific languages like SQL.
However, Access also has its limits.
First of all its interface. Microsoft Access is not very intuitive for those who approach the program for the first time. Since the first versions, its interface is not very user friendly. You have to wait for the Ribbon-based interface of Access 2007 to get an easier and more direct access to its features and, finally, the 2013 version that welcomes the new Modern UI (Metro).
Another important aspect is the size of our database. Obviously for company DB or, anyway, Big Data it is advisable to use SQL databases.
However, the current trend is to use software such as Microsoft Excel as a starting point for data analysis. To meet this need, Excel has overcome its limits, which had put it in the background compared to Access, thus becoming a commonly used software also for DB management.
… today
With the increase of data and the need for their analysis by an increasingly large and generalized audience, the IT sector has also adapted by responding with software that meets this need.
Microsoft Excel is no exception and, following the market direction, it has expanded its functionality very much, taking power away from the Access alternative.
From a simple spreadsheet, Excel has evolved into a real development tool with the addition of three components:
- Power Pivot: allows you to create a data model from a collection of tables with different relationships and from different sources
- Power Query (Get & Transform into Excel 2016): Powerful tool for data import, collection and analysis, allows you to connect, combine and refine data sources according to specific analysis needs
- Power View: ideal tool to explore, visualize and present the processed data
Still not convinced? Let’s make then a practical example of daily use of a simple database, working first with Access and then with Excel.
Real-World Application
For my shoe collection I have a table containing a series of values. Wanting to make an educational example, for simplicity I just consider a column that contains the names of the designers. In other cases you could have the column of the names of the products sold in your e-commerce or the age of your online service members. In any case, from this table with only one column containing repeated names (or numbers), we must obtain a table that counts the values, in my case the names of the designers. Example:
Bottega Veneta: 3
Jimmy Choo: 4
Manolo Blahnik: 6
Roger Vivier: 3
Sergio Rossi: 4
So we have to work with the data in order to:
- Order them (from minor to major)
- Group them together
- Count the values
We can do this with any software database, including our Access.
Using the Query Wizard and working in Design View you get:
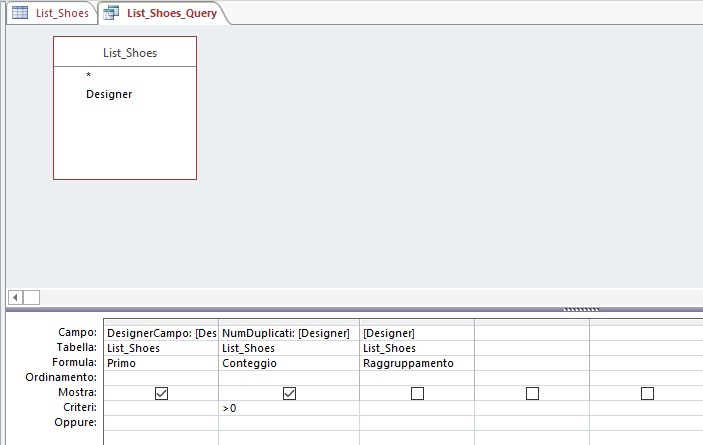
click on Run, you get the desired output.
The procedure is made easy by Access thanks to its visual query creation editor. Actually, the query is made using the following SQL code:
SELECT First(List_Shoes.Designer) AS DesignerCampo, Count(List_Shoes.Designer) AS NumDuplicati
FROM List_Shoes
GROUP BY List_Shoes.Designer
HAVING (((Count(List_Shoes.Designer))>0))
This demonstrates the flexibility and power of this tool. However, since today the trend for most users who need to analyze their data is to use Excel for convenience, what possibilities does it offer ? Also, is it as simple and immediate in Excel as with Access?
The answer is … obviously … yes!
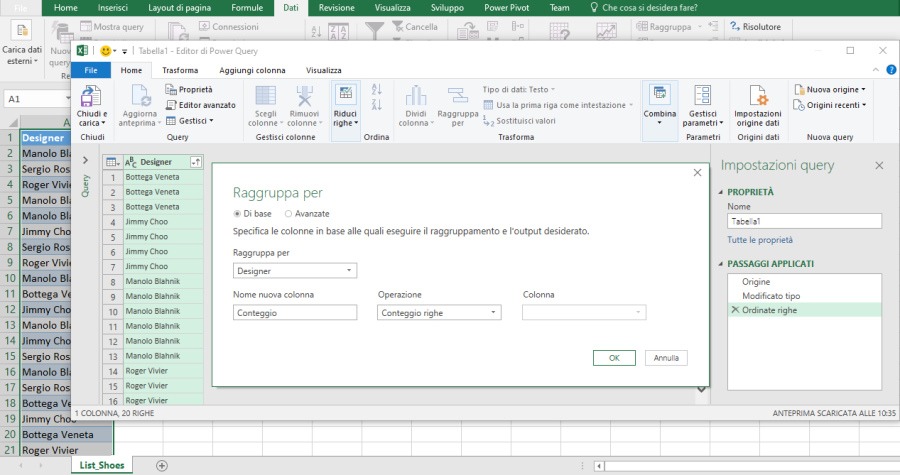
Within Excel, you can use the power query power thanks to the “Get & Transform” feature. In this way, from the initial table you can sort, group and count data in just a few steps as follows.
finally
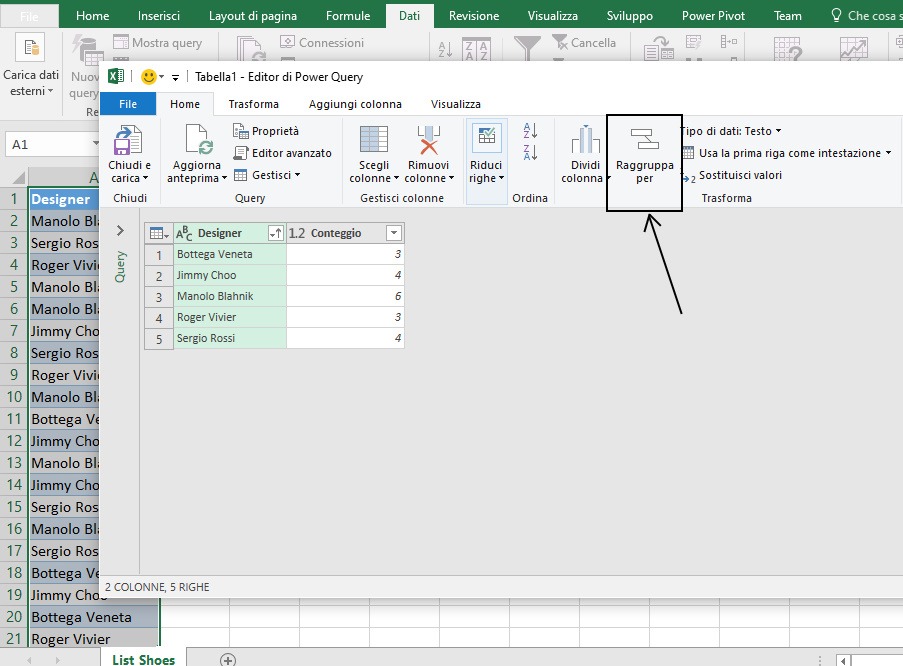
To get to the same output as Access.
That is, what used to be run inside a specific database software is now done inside Excel!
Conclusion
For the goals of this article I have deliberately used a very simple example with the sole purpose of testing the power of Excel also as a real DB.
Excel is in fact already an excellent tool, useful and accessible to all, for the analysis, simulation and prediction of data. The same case reported in the example could be solved with ‘Subtotal’ or a PivotTables.
However, for more complicated cases, such as the presence of data on multiple tables, its native functionality is not always sufficient. So Excel has included within it what are the typical tools of database allowing the solution of any kind of problem with the data.
We could say therefore that Access has been incorporated into Excel. And you … how do you process your data quickly and easily?